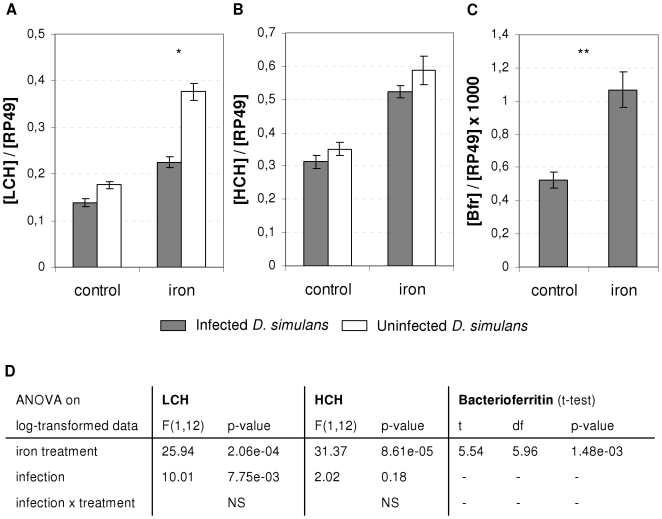
Figure 6. Ferritin expression in D. simulans.
A–C. Expression of ferritin LCH (A), HCH (B) or bacterioferritin (C) relative to ribosomal gene RP49 in aposymbiotic females (white) and symbiotic females (gray) in response to iron treatment. Expression was measured on 4 replicates of 5 females (Mean ratio±SE). Asterisks indicate a statistically significant difference (t-test with TukeyHSD adjustment, **: p<0.01, *: p<0.05) in gene expression in response to infection status for LCH or iron treatment for Bfr. D. Details of statistical analysis (ANOVA and t-test with Welch correction on log-transformed data).

