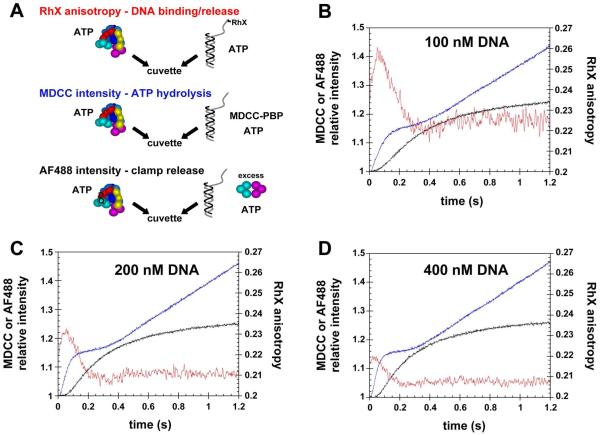
Figure 5. Temporal correlation of DNA binding, ATP hydrolysis, and release of the clamp on DNA.
A) RhX anisotropy, MDCC intensity, and AF488 intensity were measured as a function of time to follow DNA binding/release (red traces), ATP hydrolysis (blue traces), and clamp release (black traces), respectively, during the course of clamp loading reactions. For each reaction, a solution of β, γ complex, and ATP was added to a solution of p/t-DNA and ATP. Final concentrations were 100 nM γ complex, 500 nM β, 0.5 mM ATP, and B) 100 nM, C) 200 nM, or D) 400 nM p/t-DNA. Proteins were unlabeled in DNA binding/release experiments, the clamp, clamp loader, and DNA were unlabeled in ATP hydrolysis experiments, and DNA was not labeled in clamp release experiments.

