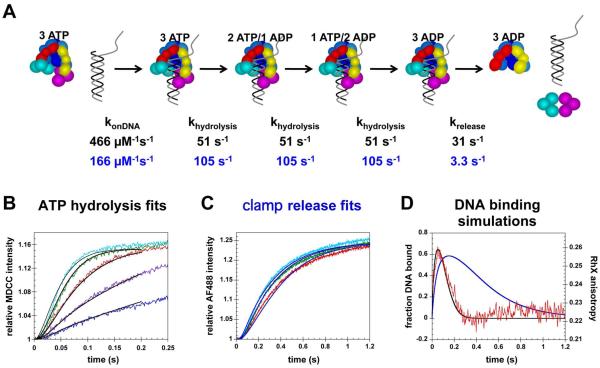
Figure 6. Kinetic modeling of clamp loading reactions with simultaneous release of the clamp and DNA.
A) Simple kinetic model used to fit and simulate data. Rate constants given in black text are from fits of ATP hydrolysis data and rate constants in blue text are from fits to clamp release data. B) The first 0.2 s of ATP hydrolysis reactions (the first turnover) were fit to the model illustrated in panel A using DynaFit (36). Calculated fits are shown in black. C) The first 1.2 s of clamp release time courses were fit to the same model and calculated fits are shown in blue. Reaction time courses in panels A and B were color-coded to the DNA concentrations as follows: 25 nM (blue), 50 nM (purple), 100 nM (red), 200 nM (green), and 400 nM (cyan). In experiments, β is present in excess (500 nM) over γ complex (100 nM) to ensure that all the γ complex was bound. The concentration of β·γ complex used in modeling was 100 nM. D) The fraction of DNA bound as a function of time was calculated using rate constants derived from fitting ATP hydrolysis kinetics (black curve) and clamp release kinetics (blue curve) for reactions containing 100 nM β·γ complex and 100 nM DNA. These simulated time courses were overlayed on the anisotropy data for DNA binding/release done at the same concentrations.

