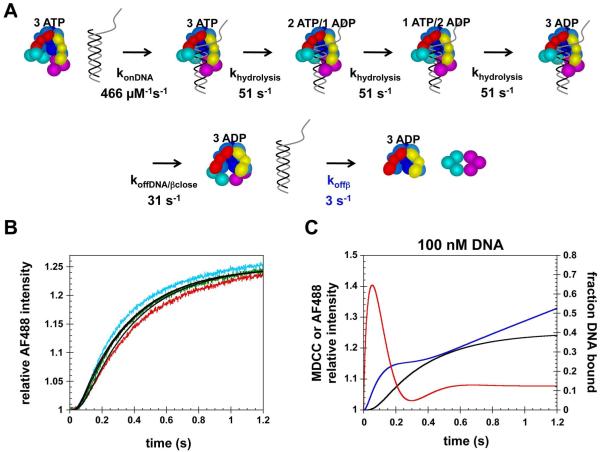
Figure 7. Kinetic model for clamp loading with sequential release of DNA and the clamp.
A) Diagram illustrating a simple kinetic model with sequential release of DNA and β in which clamp closing is coupled to DNA release. B) The kinetics of clamp release (Fig. 4B) measured at 100 nM (red), 200 nM (green) and 400 nM (cyan) were fit to the model illustrated in panel A using DynaFit (36). Rate constants in black type were fixed and the rate constant for clamp release (blue type) as well as the molar responses for the closed clamp loader·clamp complex and the free clamp loader were fit as adjustable parameters. Calculated fits are solid black lines through the data. C) The model in panel A was used to simulate the fraction of DNA bound (red trace), relative intensity of MDCC (blue trace) reporting on ATP hydrolysis, and relative intensity of AF488 (black trace) reporting on clamp release as a function of time. This model was modified to include steady-state phases for the DNA binding and ATP hydrolysis reactions (Supplementary Methods). Simulations were done for the reaction conditions used experimentally in Fig. 5B which contained 100 nM γ complex, 500 nM β, 100 nM p/t-DNA and 0.5 mM ATP.

