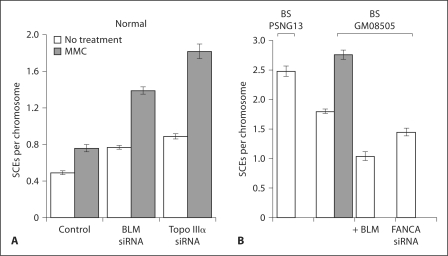
Fig. 2.
SCE formation in normal (A) and BS (B) cells. Normal (GM639) or BS cells (PSNG13 and GM08505) were treated with MMC as described in Materials and Methods and analyzed for SCE formation, with the indicated depletions. SCE are given per chromosome. + BLM indicates a complementation Bloom line, as described in Materials and Methods. The control data sets are from mock-transfected cells. Error bars represent the standard error of the mean.

