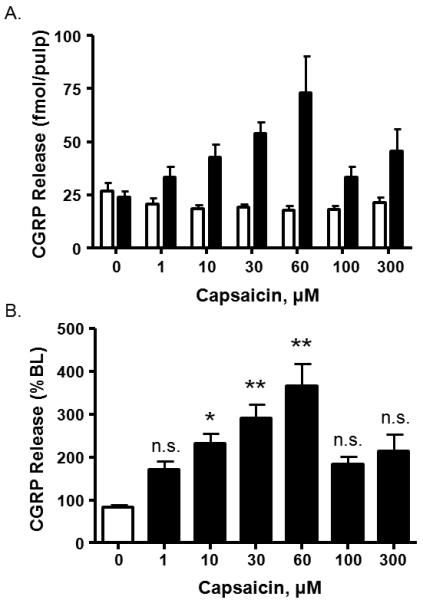
Figure 2.

Concentration-response curve of capsaicin-induced iCGRP release from human dental pulp. A. Basal (first column of each pair) and stimulated release of iCGRP in response to capsaicin application (1–300μM, n = 10). Release of iCGRP is expressed as fmol/pulp biopsy. B. Release of iCGRP normalized to the basal release for each biopsy (One-way ANOVA with Tukey's posttest: *p<0.05, **p<0.001). Each datapoint represents the mean ± SEM.
