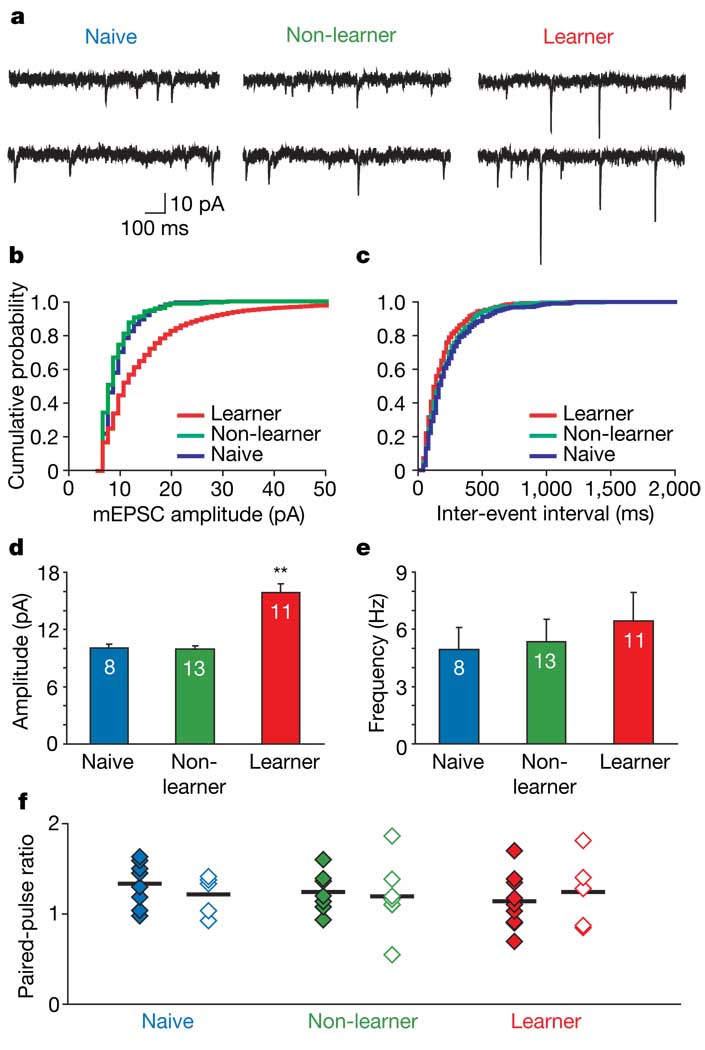
Figure 3. Successful cue–reward learning induces an increase in mEPSC amplitude but not in frequency or paired-pulse ratio.
a, Sample mEPSCs from rats that were naive, non-learners or learners. b, c, Cumulative probability plots of amplitude (b) and frequency (c) for representative neurons from each group; bins were 1 pA (b) and 20 ms (c). d, e, Learners (n = 6 rats) had increased mEPSC amplitude (d), but not frequency (e), relative to non-learners (n = 6 rats) and naive rats (n = 5 rats). Numbers in bars indicate numbers of cells; errors bars indicate s.e.m. Two asterisks, P < 0.001. f, Lack of change in paired-pulse ratio between the different groups of rats. Filled diamonds, ratios evoked from the thalamic pathway; open diamonds, ratios evoked from the cortical pathway; horizontal lines indicate the means.

