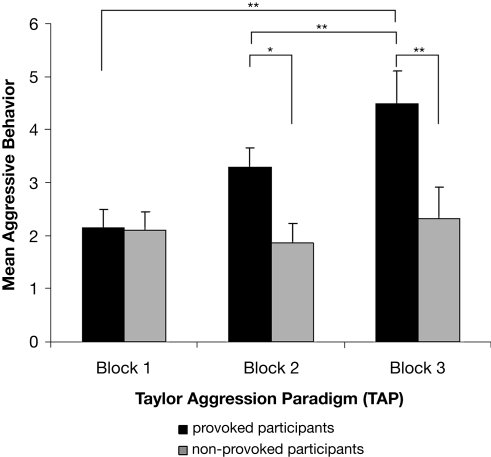
Figure 2.
Mean aggressive behavior of the provoked and the non-provoked group in the three blocks of the Taylor aggression paradigm. Note: mean aggressive behavior represents the average of the loudness and duration setting. Each block consists of 10 trials (block 1: trial 1 to 10, block 2: trial 11 to 20, block 3: trial 21 to 30). The error bars represent ±1 standard error.

