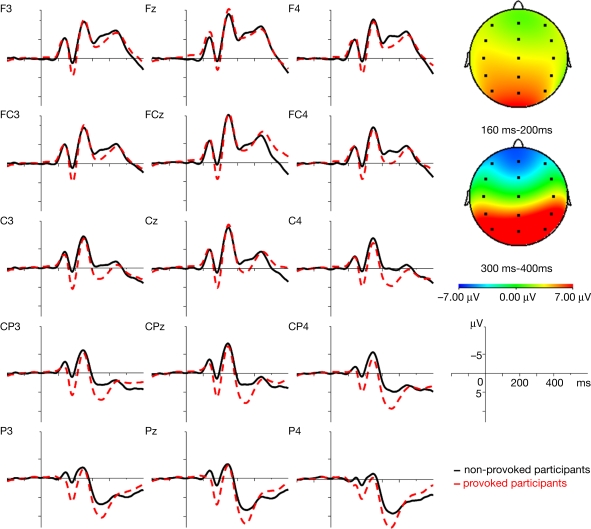
Figure 3.
Grand average ERP waveforms for the provoked (--) and the non-provoked (–) group averaged over the four facial expressions (happy, neutral, fearful, and angry) and difference maps averaged over the four facial expressions (happy, neutral, fearful, and angry) for the time domains of the P2 (160–200 ms) and P3 (300–400 ms). Note: in the difference maps, red indicates a greater positivity in the provoked than in the non-provoked group and blue refers to a greater positivity in the non-provoked compared to the provoked group.

