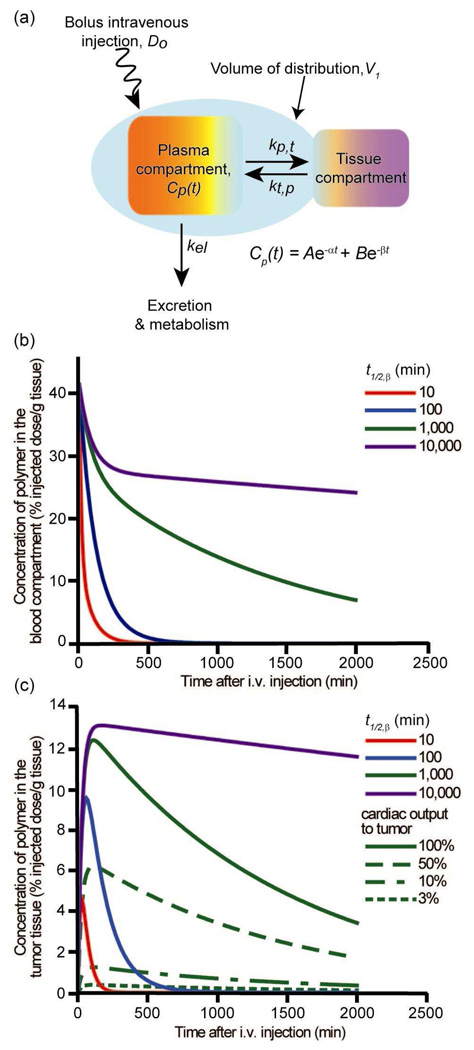
Figure 2.
Two-compartment model for predicting polymer concentration in the blood and in the tumor of a mouse (% injected dose/g tissue): (a) schematic representation of the two-compartment model. The concentration of polymer in the blood compartment is given by Cp(t), in which the variables A, B, α, and β are functions of Do, V1, and the rate constants; (b) calculated blood concentration curves versus time. The curves represent polymer concentration profiles for polymers with t1/2,β=10min, 100min, 1,000min, and 10,000min, respectively; (c) solid lines - calculated tumor concentration versus time for polymers with blood t1/2,β=10min, 100min, 1,000min, and 10,000 min, respectively, with 100% of cardiac output passing through the tumor; green lines – calculated tumor concentration versus time for a polymer with t1/2,β=1,000min with different fractions of cardiac output. All calculations assumed mouse with ~2.5g blood, and polymer with kb,t=0.012min−1, kt,b=0.025min−1, and kel=0.0006min−1.

