
Figure 7.
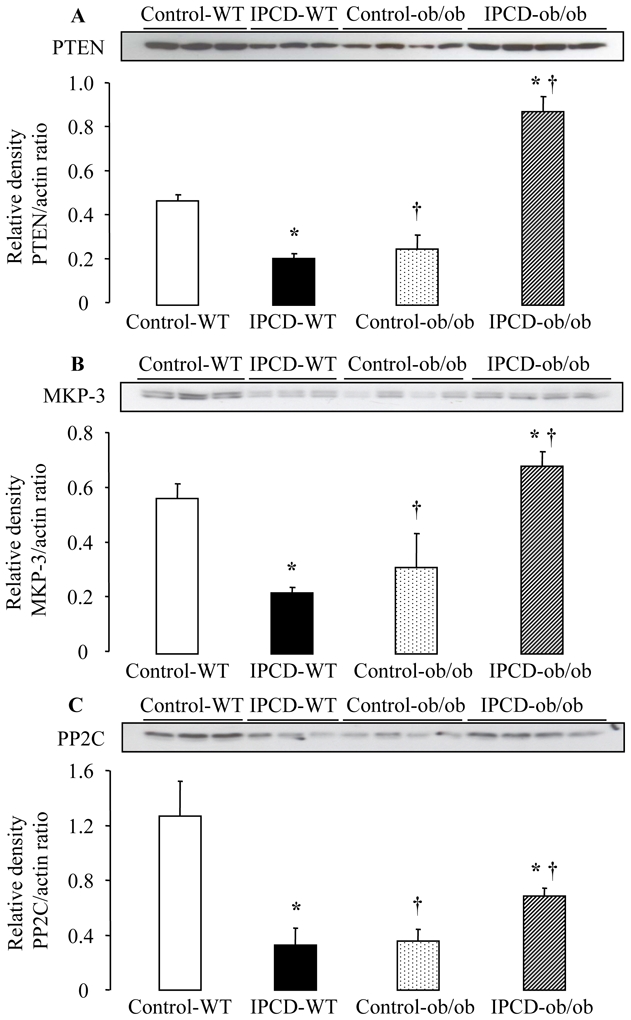
Western blot analysis of PTEN (panel A), MKP-3 (panel B) and PP2C (panel C) in wild-type (WT) and ob/ob mice submitted to 30 min of coronary artery occlusion and 10 min of reperfusion in the absence (Control) or presence of postconditioning (IPCD). Values are expressed as mean ± SEM (n=3 per group for WT mice and n=4 per group for ob/ob mice). *p<0.05 vs respective Control; †p<0.05 vs respective WT.