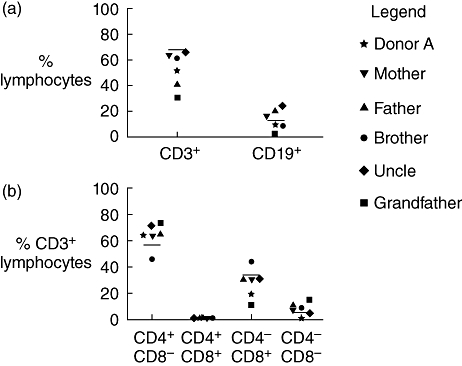
Fig. 3.

Donor A and family members have normal B cell and T cell compartments. (a) The proportion of peripheral blood lymphocytes expressing CD3 or CD19 is shown for donor A and family members. Lines indicate the means of healthy controls (T cells; n = 18, B cells; n = 12) and symbols represent individual family members. (b) The distribution of conventional CD4 and CD8 T cell subsets is shown as a proportion of CD3+ peripheral blood lymphocytes for donor A and family members. Means of control groups are represented by lines (n = 18).
