
Fig. 1.
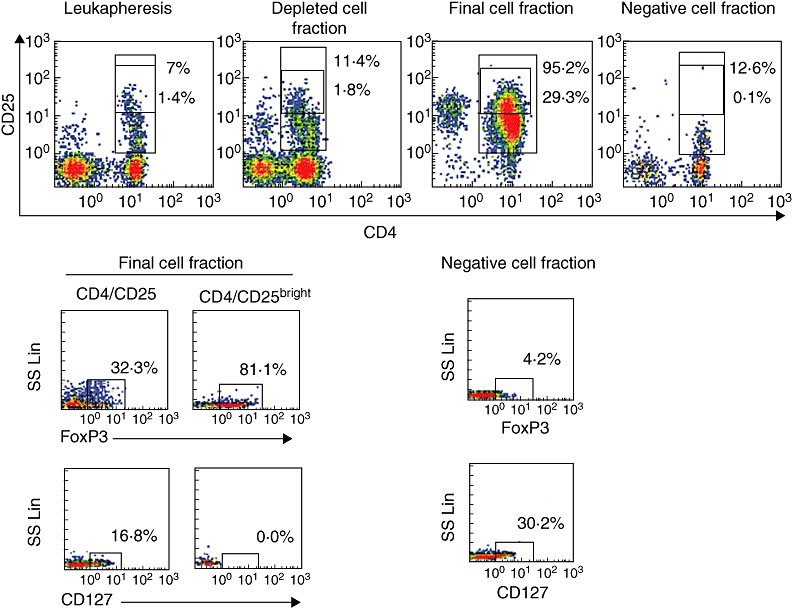
CD4+/CD25+ and CD4+/CD25bright cell fraction within starting fraction, depleted cell fraction, final cell fraction and negative cell fraction. FoxP3 and CD127 expressions in the CD4+/CD25+, CD4+/CD25bright cell fractions and in the negative cell fraction are also shown. Positive cells are boxed and the percentage of cells in the box is shown.