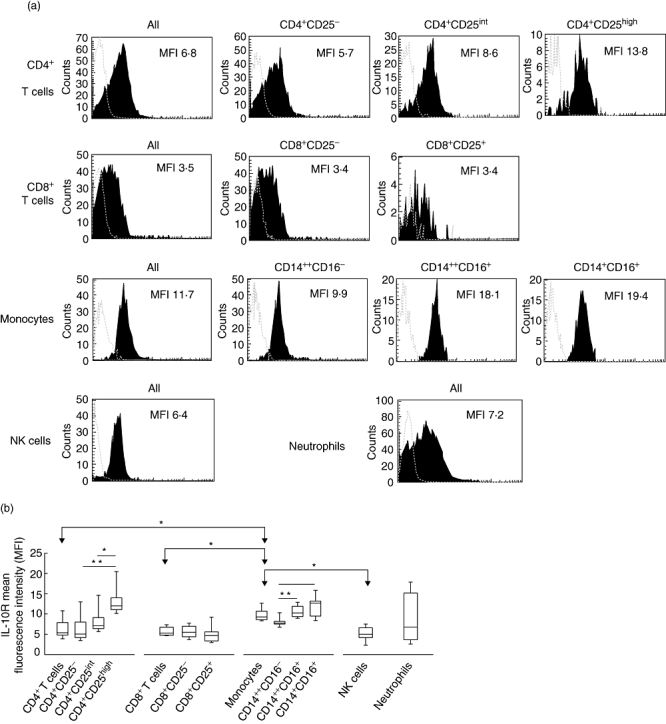
Fig. 1.

Interleukin (IL)-10R expression by peripheral blood leucocyte subsets. (a) Flow cytometric histograms representing the levels of IL-10R expression (black areas) in different leucocyte subsets in a representative sample of asthmatic patients. Values refer to mean fluorescence intensity (MFI) of IL-10R expression by the leucocyte subsets indicated. Grey broken lines represent isotype controls. (b) Summary of analyses of IL-10R expression by leucocyte subsets in asthmatic patients. Results are for the MFI of the IL-10R+ subsets. Data are depicted as box-plots. Medians are noted by inside bars and the boxes span the 25th and 75th percentiles, while whiskers represent the 5th and 95th percentiles. *P < 0·05; **P < 0·001: statistically significant differences between leucocyte subsets.
