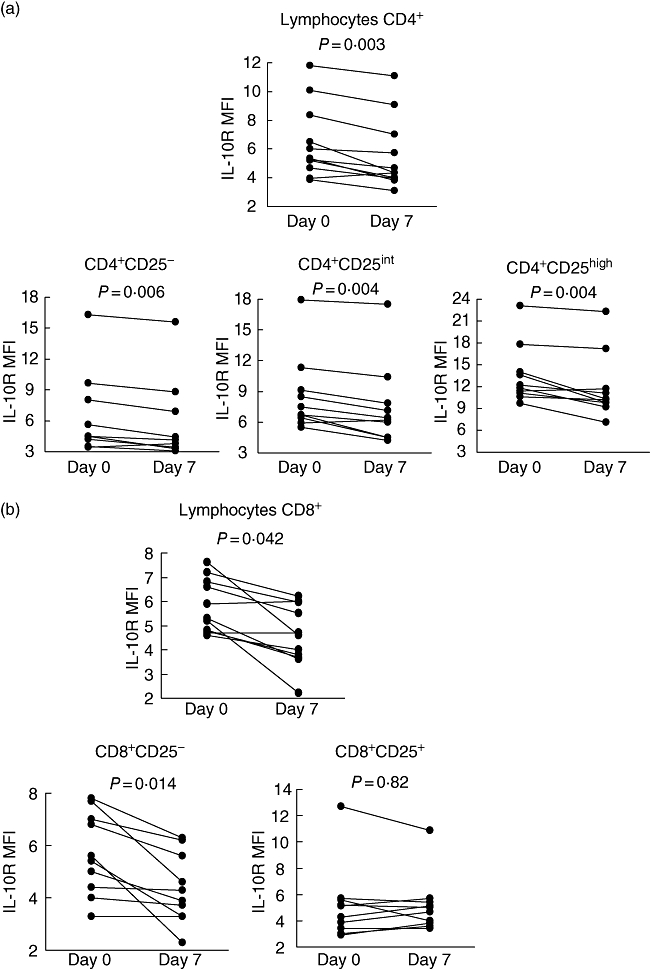
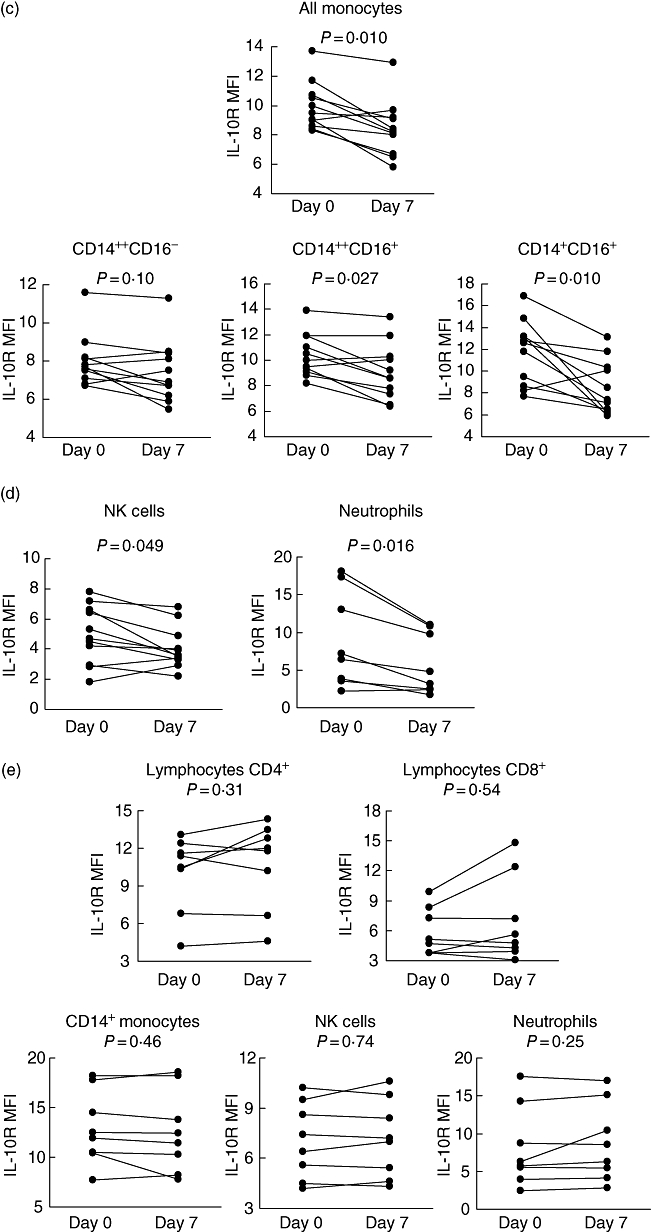
Fig. 2.


Detailed time–course analysis of frequencies of interleukin (IL)-10R+ leucocytes: (a) CD4+ T cells; (b) CD8+ T cells; (c) monocytes; and (d) natural killer cells and neutrophils, before and after administration of methylprednisolone. Statistically significant differences between pre- and post-treatment values are indicated. (e) Combined time–course analysis of frequencies of IL-10R+ leucocytes in the control group (with no oral glucocorticoids).
