Fig. 3.

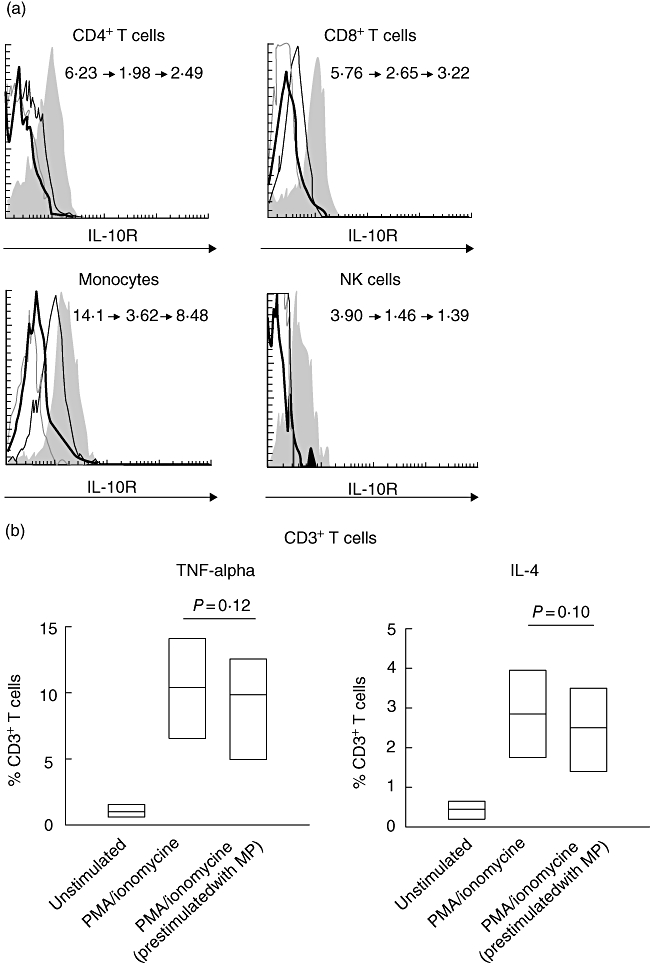
(a) Flow cytometric histograms representing levels of interleukin (IL)-10R expression in different leucocyte subsets in whole blood cultures with medium alone (grey areas), 3 µg/ml methylprednisolone (solid lines) or 0·3 µg/ml methylprednisolone (thin lines). Grey broken lines represent isotype controls. The values in histograms are for mean fluorescence intensity (MFI) of IL-10R expression by indicated leucocyte subsets in the following conditions: unstimulated (left), stimulated with methylprednisolone at 3 µg/ml concentration (middle) and stimulated with methylprednisolone at 0·3 µg/ml concentration (right). (b) The summary of analyses of tumour necrosis factor (TNF)-α and IL-4 secretion by glucocorticoids preincubated CD3+ T cells stimulated with phorbol myristate acetate and ionomycin. Results are for the percentage of TNF-α-positive and IL-4-positive CD3+ T cells. Data are depicted as box-plots. Medians are noted by inside bars and the boxes span the 25th and 75th percentiles (n = 4). MP, methylprednisolone.
