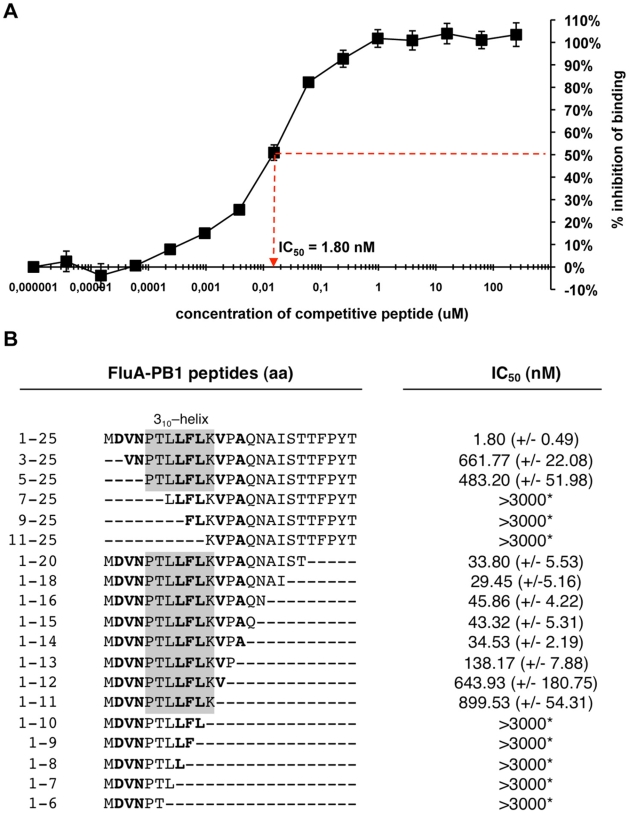
Figure 2. Quantification of the interaction between PB11–25 and PA.
(A) Determination of the 50% inhibitory concentration (IC50) of PB11–25A by competitive ELISA using the indicated increasing concentrations of peptides and cell extract containing HA-tagged PA of FluA. Error bars represent standard deviations from triplicate experiments. (B) IC50 of PB11–25A-derived peptides. S.D. is shown in parenthesis. Asterisks indicate highest concentrations of peptides (3000 nM) used without detectable inhibitory effect. Grey boxes highlight amino acids that are part of the 310-helix, which was postulated to comprise the core PA-binding region of PB1. Amino acids known to form hydrogen bonds with PA residues are represented in bold.

