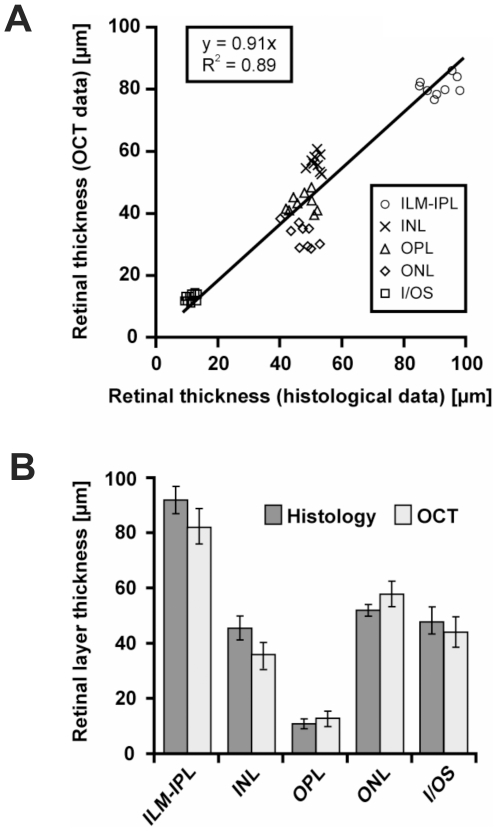
Figure 2. OCT and histological morphometric data in rodents.
Relationship between OCT and histological morphometry in C57/BL6 mice broken down to retinal layers. A) Correlation of histological and OCT data. Pearson's correlation coefficient (R2) is based on the data of all quantified retinal layers. B) Comparison of retinal layer thickness between histology (dark) and OCT (light). There was no statistically significant difference between histological analysis and OCT-based quantification in any retinal layer using Student's t-test at a significance level of p<0.05. All data are reported as mean values±standard deviation (error bars).

