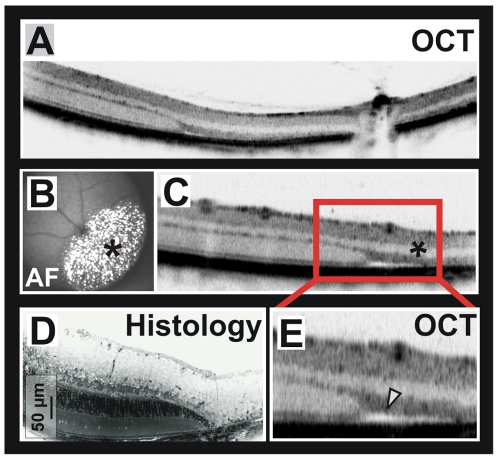
Figure 3. OCT assessment of light-induced murine retinal degeneration.
A) OCT section across the central retina, containing adjacent damaged and non-damaged areas. B) Demarcation of the damaged area in vivo by SLO autofluorescence (AF) imaging based on fluorescent photoreceptor debris (marked by an asterisk). C) Detail of the transition zone between damaged and non-damaged retina in a). The asterisk marks the damaged area as in B). D), E) Comparison of the representation of light-induced retinal damage in histology and OCT. The arrowhead in the OCT image points towards a site of retinal edema.

