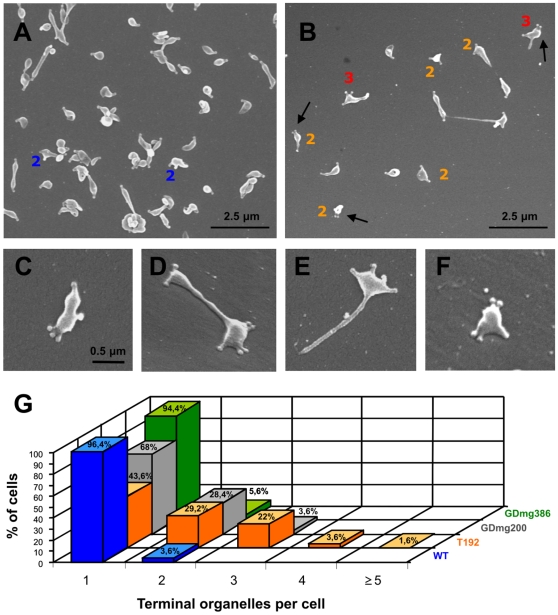
Figure 6. Scanning electron microscopy analysis.
Electron micrographs of the WT strain (A) and the T192 mutant (B–F). In (G), graphic showing the percentage of cells with one, two, three, four and five or more TO in the WT strain, the T192 mutant, and the motility mutants GDmg200 c12 and GDmg386 c1. Arrows point out cells with two TO together at the same cell pole. The number of TO per cell are indicated in cells with more than one TO. Images in panels C to F are shown at the same magnification.

