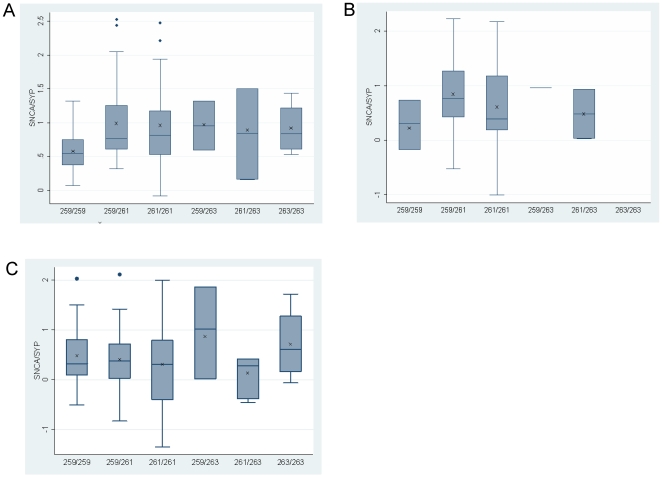
Figure 3. Effect of the SNCA-Rep1 promoter genotypes on human SNCA-mRNA expression levels in human brains.
Individuals were genotyped for Rep1. Three brain regions were analyzed: temporal cortex (A), midbrain including SN (B) and frontal cortex (C). In each brain region fold levels of human SNCA-mRNA were assayed by real-time RT-PCR using TaqMan technology and calculated relative to human SYP-mRNA reference control using the 2−ΔCt method. (A) Analysis of the temporal cortex showed that the protective genotype 259/259 correlates with lower SNCA-mRNA levels then the five other genotypes (P = 0.02). The association trend was confirmed in a subset of samples using also the GAPDH and ENO2 reference genes (Table S2). (B) In the midbrain including SN the 259/259 correlates, with lower SNCA-mRNA levels. (C) No correlations of Rep1 genotypes with SNCA-mRNA levels were detected in the frontal cortex. For each genotype the box plot represents the analysis performed using all brain samples available from the specific brain region, each of which was analyzed twice independently, each time in duplicate. The average values are presented in ‘X’. The box plot shows the median (horizontal line inside the box) and the 25th and 75th percentiles (horizontal borders of the box). The range between the 25th and 75th percentiles is the interquartile-range (IQR). The whiskers show the minimal and maximal values inside the main data body.

