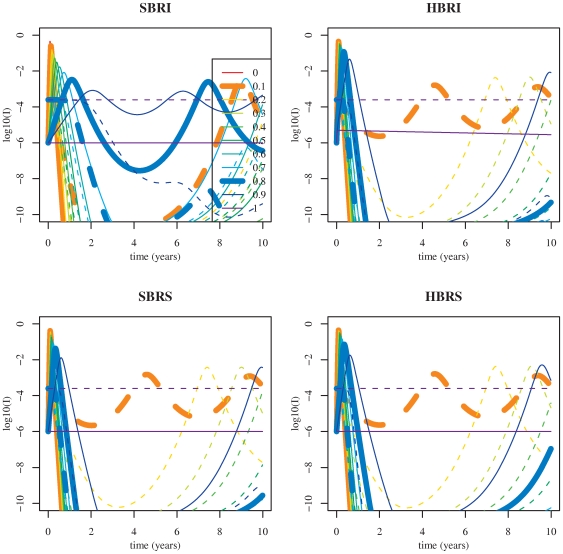
Figure 2. Transient invasion dynamics for the four two-cluster models studied.
The decimal logarithm of the proportion of infectious hosts for the mutant antigenic cluster (plain lines) and for the resident cluster (dashed lines) is represented as a function of  . Colours correspond to different partial cross-immunity (
 ) values: from
  (antigenic shift, no cross-immunity) to
  (antigenic drift, full cross-immunity). Parameter values are given in Table 1 (theoretical set). Initial conditions are:
  ,
,  .
.

