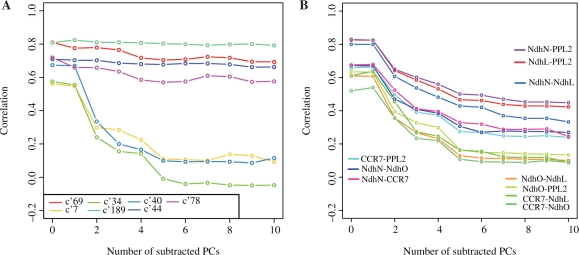
Fig. 2.
Correlation changes (A) in the genes in Photosystem II and (B) in NDH-related genes. Each line corresponds to the cluster with rmsd <0.05, and the names of gene pairs in each cluster are shown in Table 1 for (A) and specified in the figure for (B).

