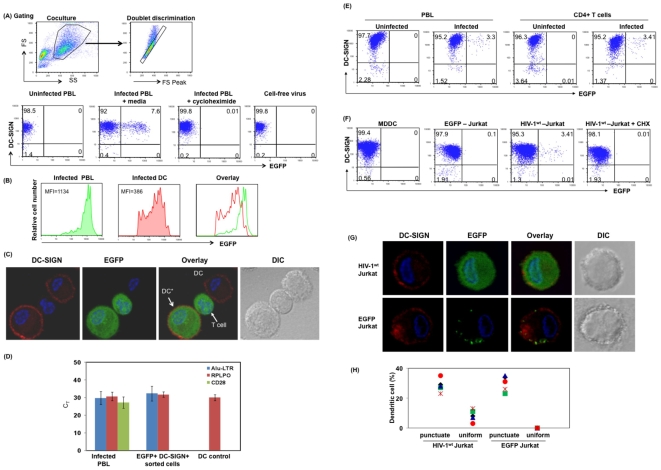
Figure 1. Reporter virus positive DC are the result of cis infection of DC.
(A) DC were cocultured with HIV-1wt-EGFP reporter virus-infected PBL cells in the presence or absence of cycloheximide (10 µg/ml); or infected with cell-free virus. Post coculture (12 hrs), cells were stained for DC-SIGN. DC were gated based on side scatter and forward scatter followed by doublet discrimination (as shown in gating) and assessed for EGFP by flow cytometry. DC-SIGN and EGFP positive cells (%) are shown in the upper right quadrant. (B) Comparison of EGFP fluorescence (MFI) in infected lymphocytes and infected DC. Overlay of histogram of EGFP fluorescence in infected lymphocytes (green) and infected DC (red). (C) Detection of DC expressing EGFP by immunofluorescence microscopy. Red indicates DC-SIGN positive cells; green represents EGFP positive cells; Blue represents nuclear staining by DAPI. DC*, represents DC-SIGN and EGFP positive DC. (D) Detection of integrated HIV-1 proviral DNA in EGFP+ DC. DC were stained for DC-SIGN, and DC-SIGN+/EGFP+ DC were sorted by FACS. Integrated proviral DNA was assessed by real time Alu-LTR Taqman assay as described in Methods. To rule out contaminating lymphocytes in DC-SIGN+/EGFP+ sorted DC, mRNA from the sorted cells were evaluated for presence of CD28 mRNA by real-time PCR. RPLPO was used as control. Uninfected DC, Infected PBL controls were included. (E) DC were cocultured with HIV-1wt-EGFP reporter virus-infected PBL cells or with HIV-1wt-EGFP reporter virus-infected purified CD4+ T cells, or uninfected control cells. Twelve hours post coculture, cells were stained for DC-SIGN and assessed for EGFP positivity by flow cytometry. Cells (%) that are positive for DC-SIGN and EGFP are shown in the upper right quadrant. (F) DC were cocultured with either HIV-1wt-EGFP reporter virus-infected Jurkat T cells or with Jurkat cells expressing EGFP protein. Post coculture, the cells were stained for DC-SIGN and analyzed by flow cytometry or by (G) Immunofluorescence microscopy. DC-SIGN+/EGFP+ cells were gated based on the amount of EGFP in DC-SIGN+ cells to differentiate antigen uptake and productively infected DC. Results from multiple donors are shown in Fig. 1H, where 200 DC were counted scanning multiple fields (Fig. S2) for each culture. Figure represents one of 5–7 independent experiments with similar results.

