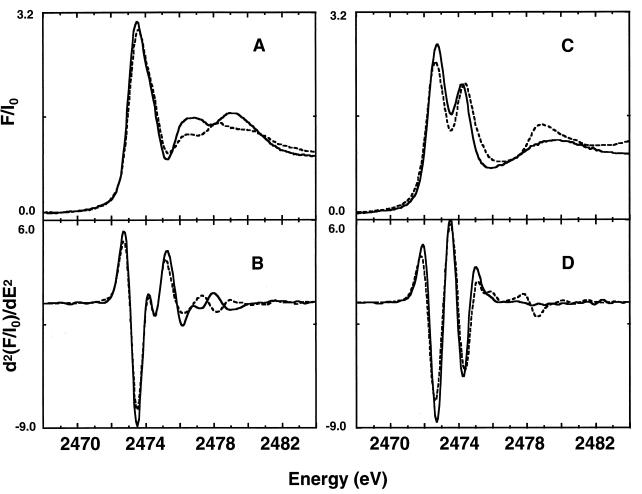
Figure 2.
(A) Normalized S K-edge x-ray absorption spectra of reduced glutathione (solid line) and cysteine (dashed line). (B) Second derivatives of reduced glutathione (solid line) and cysteine (dashed line). (C) Normalized S K-edge x-ray absorption spectra of oxidized glutathione (solid line) and cystine (dashed line). (D) Second derivatives of oxidized glutathione (solid line) and cystine (dashed line). All sample materials were in the form of solids.

