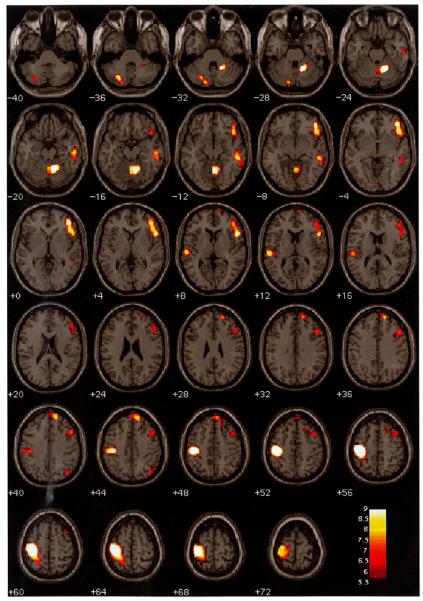
Fig. 1.
Illustration of the areas where there were significant lateralized differences in the amplitude of hemodynamic response to target stimuli versus the standard baseline (P < 0.01 FWE, corrected for searching the whole brain). Active voxels in the left hemisphere show L > R; active voxels in the right hemisphere show R > L. The figure is in neurological convention (that is, the left hemisphere is on the left).

