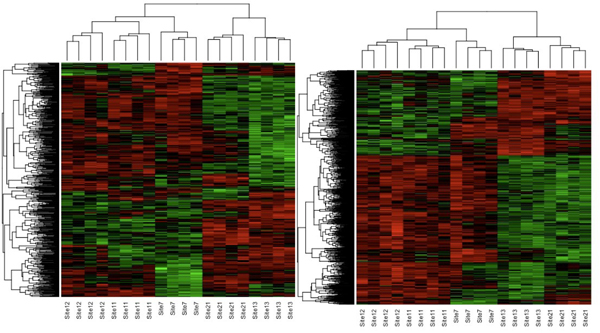
Figure 4.

Hierarchical clustering. Two-way hierarchical clustering for genes differentially expressed following 48 h exposure at each of the sites. Expression data was analyzed by ANOVA and then z-transformed. Genes used in the cluster were significant at P < 0.05. Represented are genes that are up-regulated (red) or down regulated (green) by the treatments compared to controls. (A) Cluster for genes changed in the liver and (B) cluster for genes changed in the gonad.
