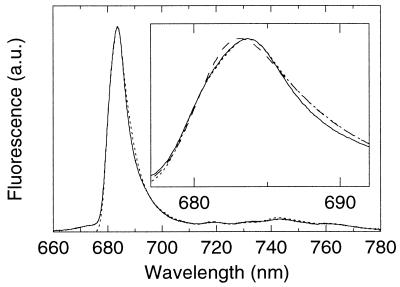
Figure 4.
Experimental (solid line, as in Fig. 1) and simulated (dotted line) nonselectively excited emission spectrum of PSII RC. Parameters of the simulation: S = 1.6; IDF, two Gaussians at 683.6, width 70 cm−1 (fwhm) and at 680.6 nm, width 80 cm−1 (fwhm) with relative (area) contribution of 0.91. (Inset) A magnification of the main peak. A simulation (dashed line) is shown with a single Gaussian at 681.7 nm, width 110 cm−1 (fwhm) as IDF and S = 1.6. It should be noted that below 685 nm the dotted and solid curve and above 685 nm the dashed and dotted curves almost coincide. For details see text.

