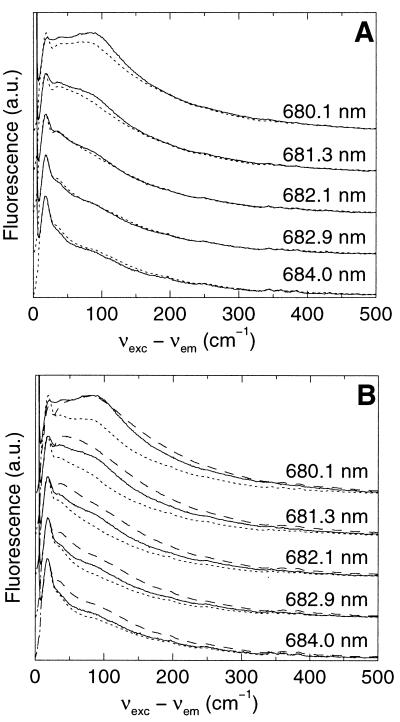
Figure 5.
Experimental (solid line) and simulated (dotted and dashed lines) emission spectra selectively excited at 680.1, 681.3, 682.1, 682.9, and 684.0 nm. The IDF used for the simulations consists of two Gaussians at 683.6, width 70 cm−1 (fwhm) and at 680.6 nm, width 80 cm−1 (fwhm) with a relative (area) contribution of 0.91. (A) S = 1.6. (B) S = 1.2 (dotted line) and 2.0 (dashed line). For details see text.

