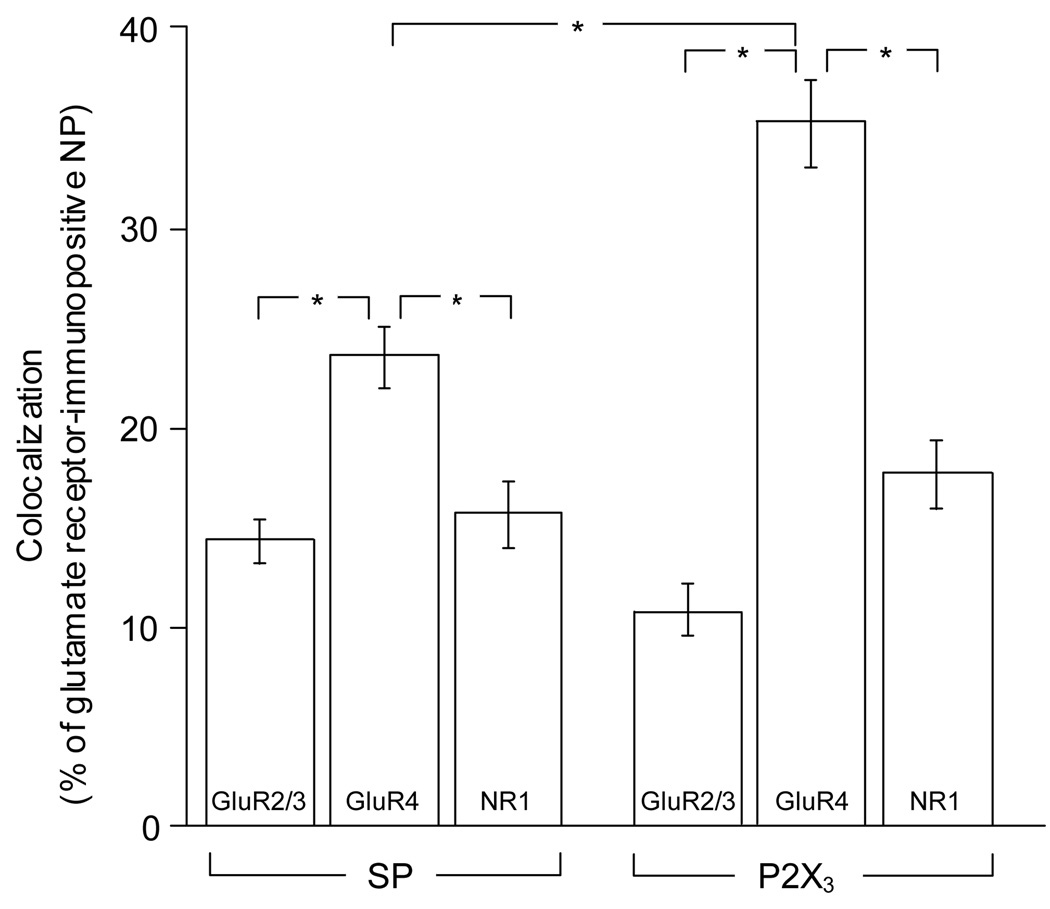
Fig. 3.
Graphs show percent (mean ± S.E.M.) of SP-positive (indicated at the bottom) or P2X3-positive DRG neuronal profiles that immunostain for glutamate receptor subunits (indicated within the columns), as a fraction of all glutamate receptor-expressing neuronal profiles (NP) for each double immunostaining. *p<0.001, one-way ANOVA followed by Tukey’s post hoc test

