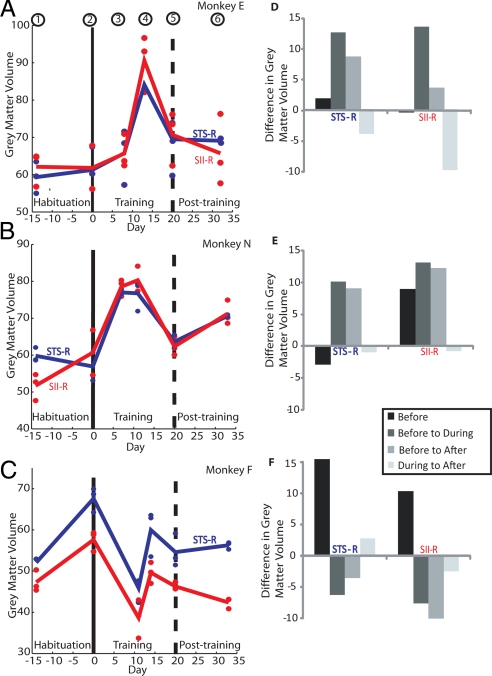
Fig. 3.
Time course and extent of gray matter change in peak voxels. (A–C) Gray matter volume for each time point in monkeys E (A), N (B), and F (C) for voxels in right STS (blue) and right SII (red), the cortical areas with most significant effects (Table 1). Circles indicate gray matter volume from each of the three scans acquired at each scanning session. Lines are drawn between mean values for each session (sessions 1–6). Only two scans were available for monkey N for session 2. (D–F) Changes in gray matter volume across scans in each monkey. “Before” indicates mean session 1 − mean session 2; “before to during,” mean (sessions 1 and 2) − mean (sessions 3, 4, and 5); “before to after,” mean (sessions 1 and 2) − mean session 6; and “during to after,” mean (sessions 3, 4, and 5) − mean session 6. In monkeys E (D) and N (E), there were increases in gray matter volume during the training period relative to habituation of up to 14% (monkey E) and 13% (monkey N). Across monkeys E and N, Z scores were 7.2 (STS) and 6.7 (SII). Gray matter after training (sessions 5 and 6) remained higher than before training [sessions 1 and 2; Z scores were 5.8 (STS) and 5.9 (SII)] but fell slightly relative to training [sessions 3 and 4; Z scores 4.7 (STS) and 4.3 (SII)]. This pattern of effects is consistent with the time course of learning rather than time in the experiment per se. In monkey F (F), gray matter volume decreased in the right STS and SII voxels during training.

