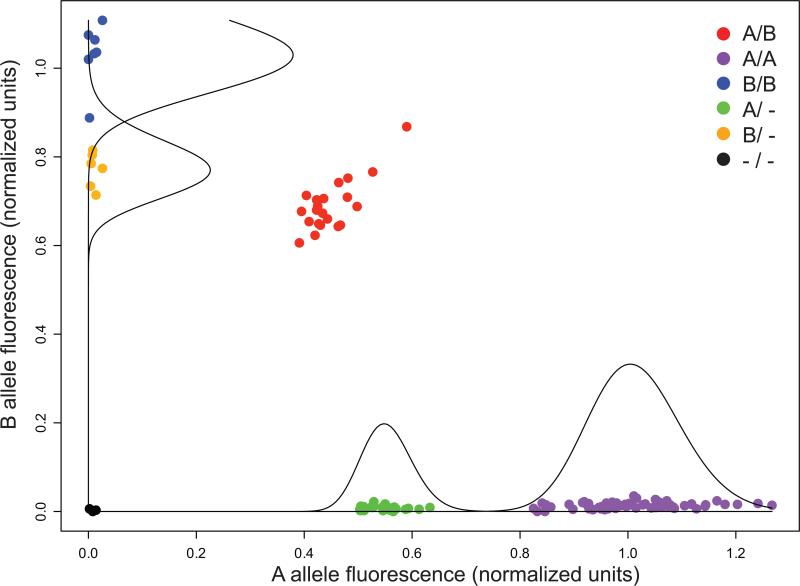
Figure 4.
Example of fluorescence intensity measurements for each of 126 samples for a single SNP probe (rs10076425). These data are used by SCIMM (SNP-Conditional Mixture Modeling) to automatically determine insertion/deletion genotypes (see Methods). The genotype for each sample is denoted by color as indicated in the legend. Mixture component distributions are represented by superimposed curves on both the X and Y-axes. In this case, insertion/deletion status is computed by analyzing this probe in conjunction with four additional probes within a deleted region at chr4:10070382−10076653 (Supplementary Data S3).

