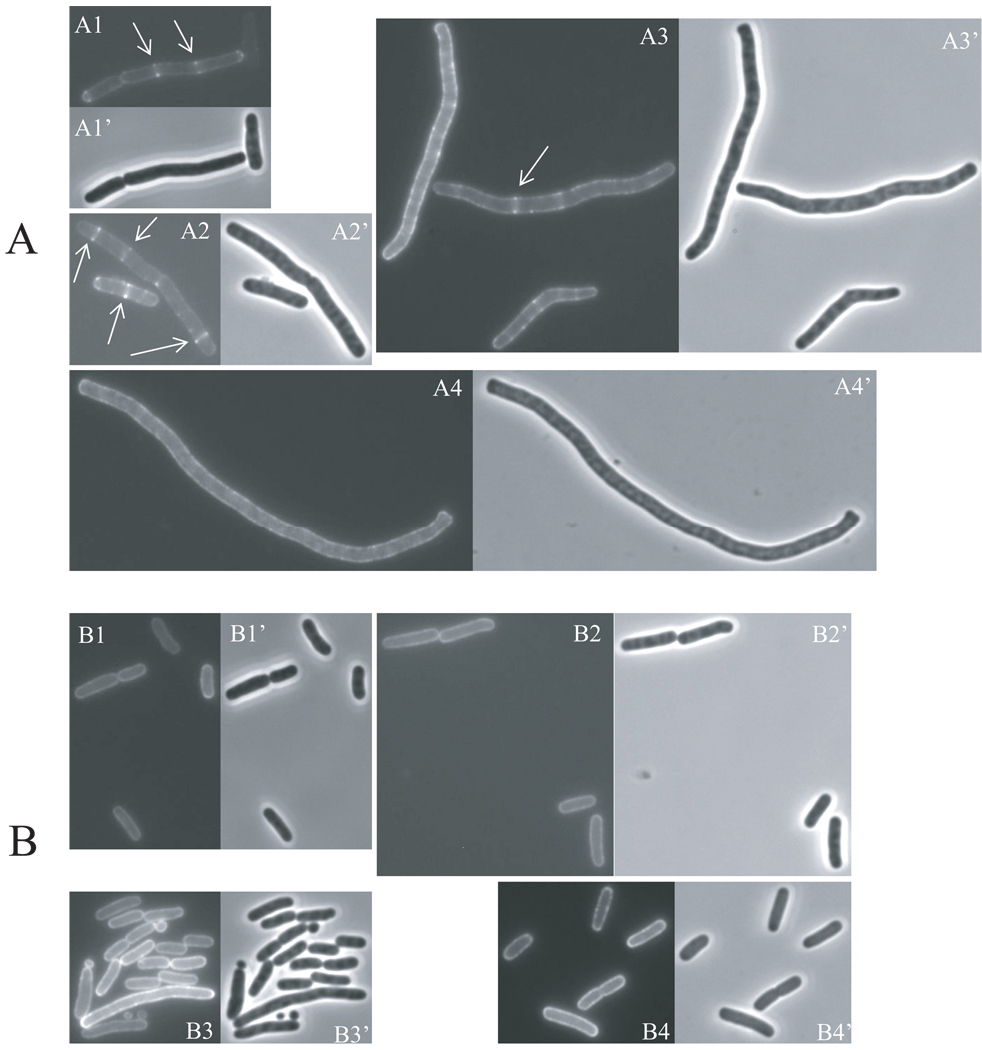
Fig. 3.
GFP-MinCC/MinD does not localize to Z rings composed of FtsZ-I374V. Expression of GFP-MinCC/MinD was induced with IPTG in S4/pHJZ109 [ftsZ-WT, min∷kan/P∷gfp-minCCD] (A) and BSM374/pHJZ109 [ftsZ-I374V, min∷kan/Plac∷gfp-minCCD] (B) and samples at various times were subjected to fluorescent microscopy. Fluorescence micrographs (A1-A4, B1-B4) and the corresponding phase contrast images (A1’-A4’, B1’- B4’) showing the localization of GFP-MinCC/MinD over time in these two strains are presented. Cells were grown in the presence of 50 µM IPTG at 37°C for 0 min (A1, B1), 40 min (A2, B2), 70 min (A3, B3) and 100 min (A4, B4). Arrows in panel A indicate GFP-MinCC/MinD localized to rings. The contrast and brightness of these pictures are adjusted unequally for better viewing.

