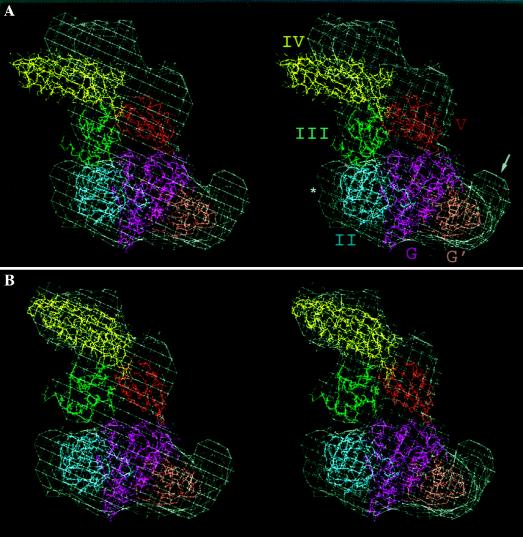
Figure 2.
Stereo view showing the fitting of the crystal structure (9) of EF-G–GDP into the extra mass of density corresponding to EF-G. The density map corresponding to EF-G is shown in white wire-mesh form. The various domains of the crystal structure are shown in different colors. (A) Fitting using domains I and II as the main guide to align the whole crystal structure into the density map (see text). (B) Separate fitting of the substructure formed by domains III–V (see text). To obtain an optimum fit, this structure was shifted by approximately 10 Å toward the central protuberance of the 50S subunit and rotated by about 10°, around a pivoting point in the contact region between domains II and III, toward the L1 side, whereas domains I and II were left in the same position as in A. The arrow points to the portion of the density map that is partially occupied by the G′ domain and involved in making the arc-like connection with the L7/L12 stalk (see also Figs. 1B and 3B). The asterisk shows a partially unoccupied region that probably comes from the ribosome because of a conformational change at the site of interaction with domain II.

