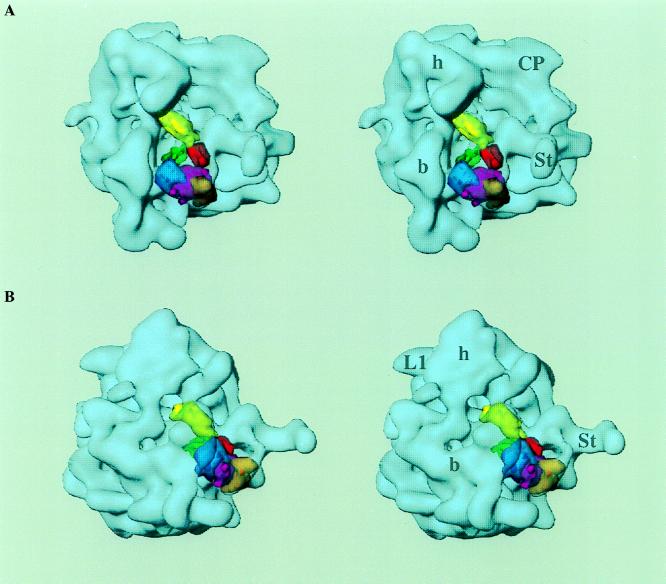
Figure 3.
Stereo view of a low-resolution version of the EF-G x-ray structure shown in Fig. 2B, superimposed onto the 3D map of the 70S–EF-G–GDP–fusidic acid complex (shown as a transparent blue surface). Color coding for different domains of the x-ray structure is the same as in Fig. 2: domain I, magenta and brown (core G domain, magenta; insert G′ domain, brown); domain II, blue; domain III, green; domain IV, yellow; and domain V, red. (A) In the intersubunit face view, the 30S subunit is on the left and the 50S subunit on the right. (B) Same as a but presented from the 30S-solvent side to show that the G′ domain is involved in the formation of the arc-like structure with the base of the L7/L12 stalk. Because only the lower part of the arc-like structure is occupied by the x-ray structure, the upper part is probably contributed by the C-terminal domain of one of the folded L7/L12 molecule (see text), which becomes pronounced only upon factor binding (see also ref. 24). Landmarks have been abbreviated to avoid visual complexity of the stereo picture. For 30S subunit: h, head; b, body. For 50S subunit: CP, central protuberance; St, L7/L12 Stalk; L1, L1 protein.

