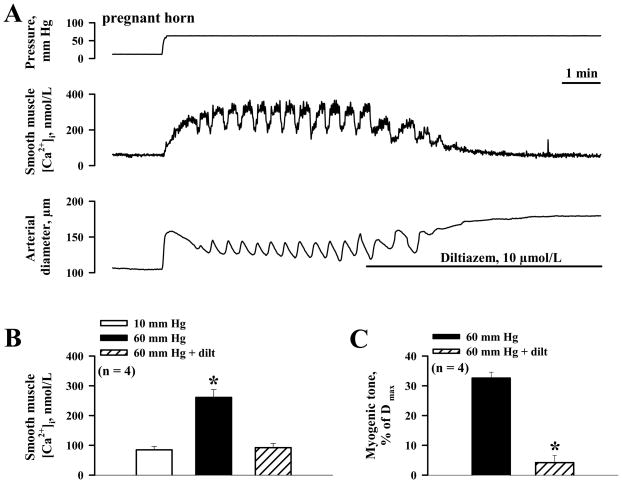
Figure 6.
A, Representative tracings showing inhibition of pressure-induced SMC [Ca2+]i elevation and myogenic tone by 10 μmol/L diltiazem. B, Summary graph demonstrating the effects of diltiazem on the level of SMC [Ca2+]i in response to pressure elevation from 10 to 60 mm Hg. *Significantly different from SMC [Ca2+] levels at 10 mm Hg (paired Student’s t-test). C, Bar graph summarizing the effects of diltiazem on myogenic tone induced by pressure elevation from 10 to 60 mm Hg. Myogenic tone is expressed as a percentage of the fully dilated diameters (Dmax) of each artery (in the presence of a combination of papaverine and diltiazem). *Significantly different from myogenic tone before application of diltiazem at P < 0.05 (paired Student’s t-test). On B and C, Numbers in parentheses indicate the number of arteries tested.

