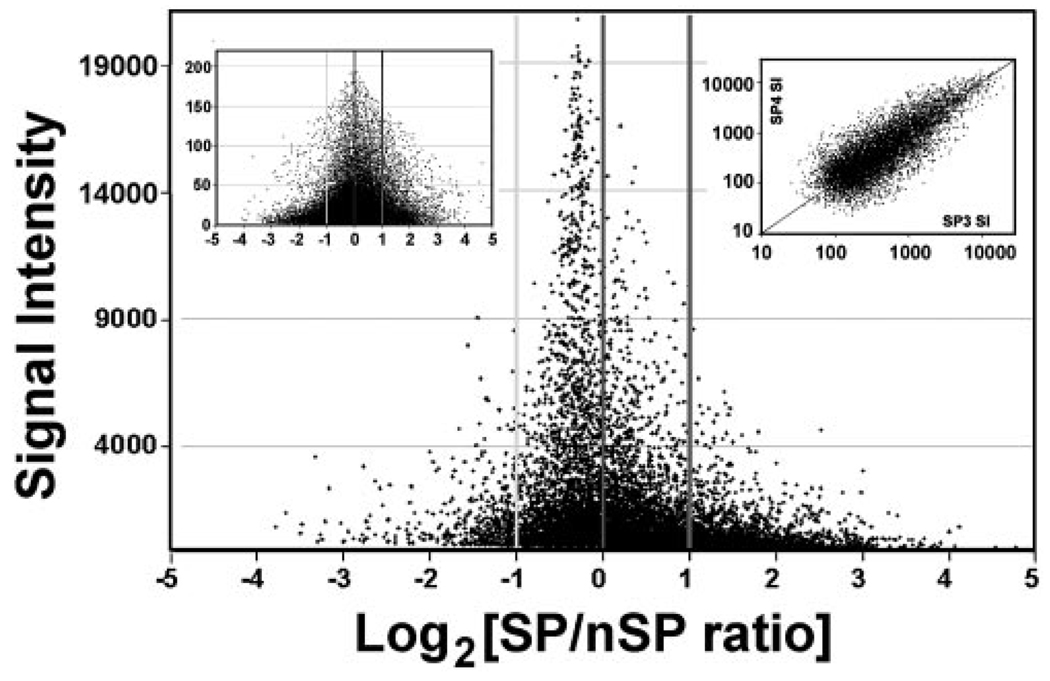
FIGURE 3.
Plot of log2 of SP/nSP ratios versus signal intensity (SI). Main frame. Expressed transcript set. Note that there are many more transcripts in the >+1 (ratio, 2) than in the >−1 range. Left side inset: nonexpressed transcript set. For graphic clarity SIs below 100 have been excluded. Right side inset: logarithmic plot of SIs for the SP cells of the first and third microarray experiment. Only SIs with a 98% confidence level (MAS5) have been included.

