
Fig. 2. VFO-associated spikelets in a mouse Purkinje cell and a model Purkinje cell.
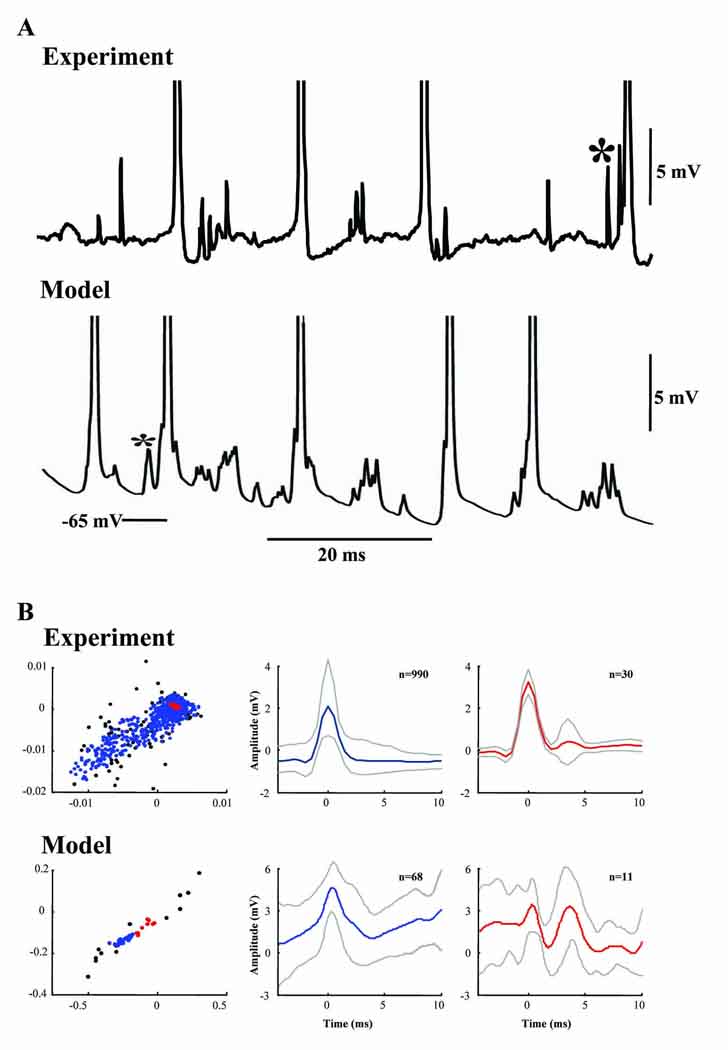
(A) In some Purkinje cells, barrages of spikelets occur at varying amplitudes (Middleton et al., 2008), and similar barrages occur in the somata of Purkinje cells during network VFO in the model. On occasion (*), spikelets occur just prior to full action potentials (which are truncated in both experimental and model records). (B) Results from cluster analysis of spikelets recorded from Purkinje cell somata (experiment) or present in somatic compartments in the Purkinje cell network model. Experimental data (upper panels) were taken from a set of 1,080 spikelets. Left graph shows the distribution of spikelet properties as 1st vs. 2nd wavelet coefficients. Spikelets in the largest cluster (blue) show large, approximately linear variability in wavelet coefficients. Spikelets in the second largest cluster are shown as red symbols and all remaining spikelets are shown as black symbols. Middle and right graphs show the mean (± 1S.D.) spikelet shapes for the largest and 2nd largest clusters respectively. 90% of spikelets form the large cluster. Lower panel shows results from the same cluster analysis applied to model data containing 91 spikelets. The distribution of spikelet properties showed a similar coefficient variability to the experimental data. 75% of spikelets form the large cluster. Note that, both in experiment and model, the spikelets in the second largest cluster did not appear to have different shapes compared to those mapped to the largest cluster, but rather were occurring in multiplets rather than singlets.