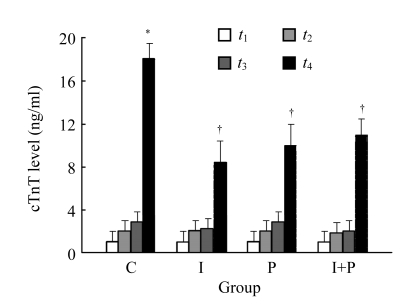
Fig.2.
The plasma levels of myocardial troponin (cTnT) for the four groups of animals at the four time points: t 1, 30 min after stabilization; t 2, immediately before the start of coronary artery occlusion; t 3, 60 min after the start of coronary artery occlusion; and t 4, 120 min after the start of reperfusion. Data are mean±SD of 8 rats per group. * P<0.01, compared with C group at t 1; † P<0.01, compared with C group t 4. The assay was performed in duplicate and averaged

