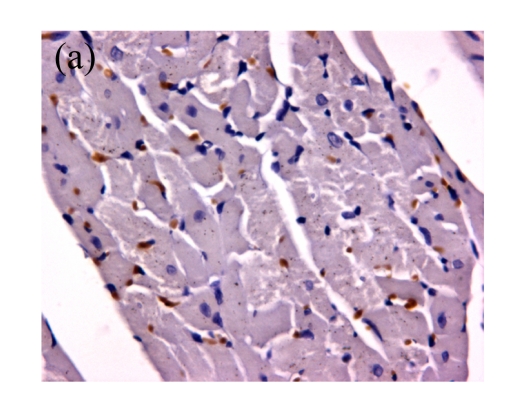
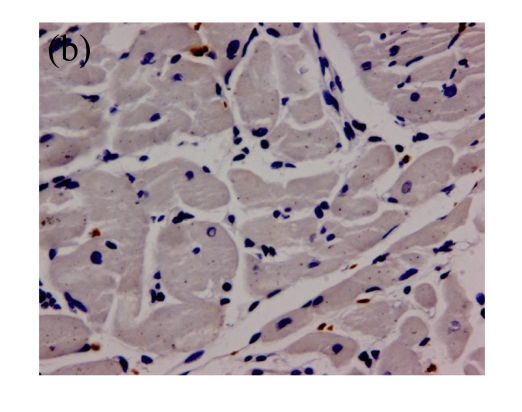
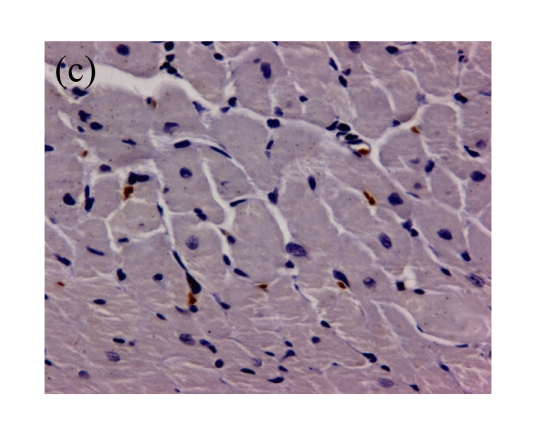
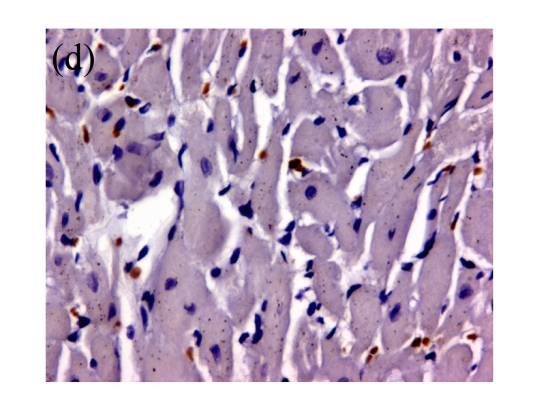
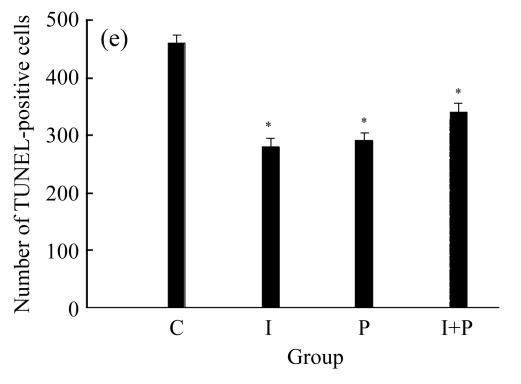
Fig.4.
(a)~(d) Representative photomicrographs depicting TUNEL-stained left ventricular tissue sections from (a) a control rat without any intervention (C group), (b) an isoflurane preconditioning rat (I group), (c) a propofol preconditioning rat (P group), and (d) an isoflurane plus propofol preconditioning rat (I+P group). The myocardial TUNEL was performed at the time point of 120 min after the start of reperfusion. (e) Quantitative data are summarized with the number of TUNEL nuclei expressed at 30 fields per section. * P<0.01, compared with C group. Data are mean±SD of 8 rats per group

