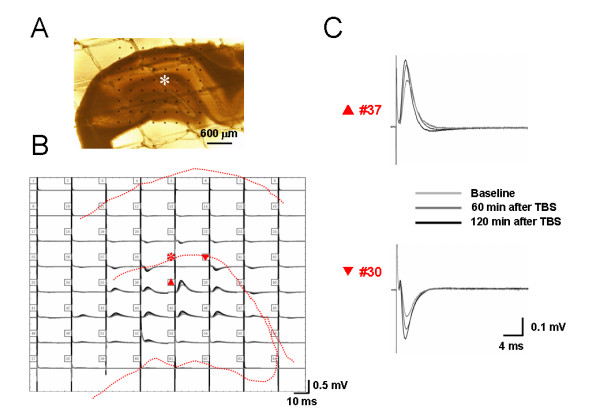
Figure 1.

Showing a typical example of the MED64 probe recordings on the hippocampal slice of a rat receiving saline injection into a hindpaw. A, a photograph showing one hippocampal formation (HF) positioned on a Med64 probe with 8 × 8 arrays (interelectrode distance: 300 μm). The asterisk indicates an electrode selected for electrical stimulation of perforant path (PP) fibers. The dorsal part of the HF corresponds to the top of the image, and the lateral side of the HF is shown at left of the image. B, real traces of 63 recording electrodes across the dentate gyrus (DG) and the CA1 area in response to the PP test stimulation before, 60 min and 120 min after theta burst conditioning stimulation (TBS). Dashed lines indicate the anatomical contour of the HF. C, example field potentials of the electrodes #37 and #30 (indicated by upward and reverse arrows in B) were shown to be positive-going (upper) in the DG and negative-going (lower) in the CA1. The amplitude of the field potentials in both areas was potentiated for a long-term period after TBS conditioning of the PP fibers (asterisk in B). Scale bar in A: 600 μm; Vertical scale in both B and C indicates amplitude of the potentials, while horizontal scale indicates time sweep.
