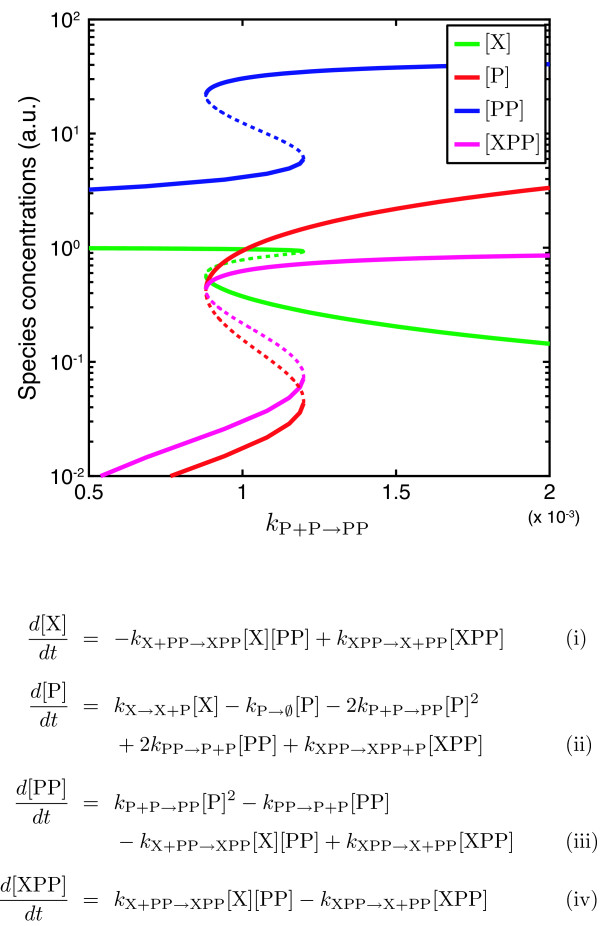
Figure 4.
Bistable autoregulatory motif. The autoregulatory motif shown in Fig. 3B admits two stable equilibria, as shown in this bifurcation diagram. Stable steady states are denoted with solid lines, and unstable steady states are denoted with dashed lines. Equilibrium concentrations for X, P, PP, and XPP are plotted as a function of the association rate constant for dimer formation. The mass-action ODEs for this motif are also given. The other parameters obtained from the CRNT are: kX→X+P = 2.81, kP→∅ = 1, kPP→P+P = 0.98, kX+PP→XPP = 2.76, kXPP→X+PP = 1.55, and kXPP→XPP+P = 46.9. The unimolecular rate constants and dissociation rate constants are in units of time-1, while the bimolecular association rate constants are in units of conc-1time-1.

