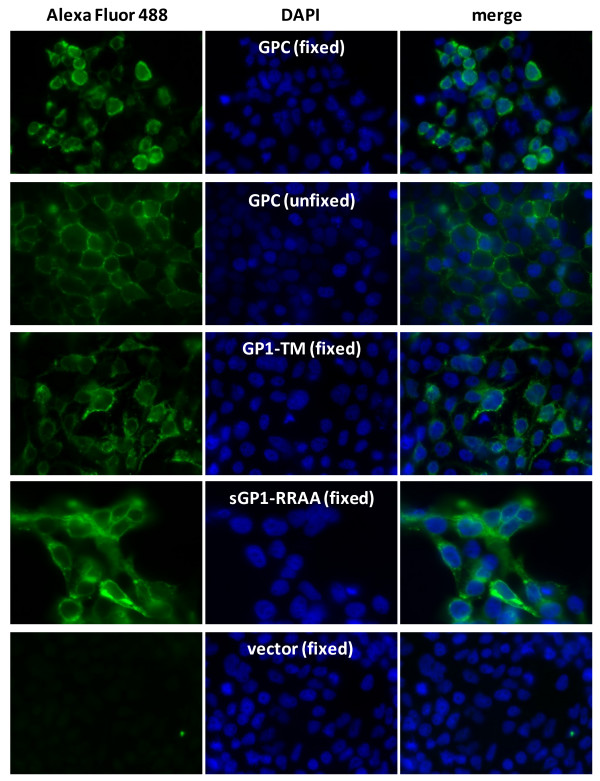
Figure 4.
Expression profile of LASV GPC, GP1-TM, and sGP1-RRAA-FLAG in HEK-293T/17 cells by immunofluorescent microscopy. HEK-293T/17 cells grown on cover slips and transfected with LASV glycoprotein constructs were stained with anti-GP1 mAb L52-74-7A and Alexa Fluor 488 secondary antibody, and counterstained with DAPI. Cells were fixed and permeabilized prior to staining (panels A, C, D, and E), or were stained live (panel B). Each panel shows captured fluorescent images of cells at 60× magnification, in oil immersion, with the same exposure settings used throughout for the given fluorochrome (300 ms for FITC channel; 175 ms for DAPI channel). Cell surface and intracellular GP1 (Alexa Fluor 488, panels A - E), stained nuclei (DAPI, panels A - E), and merged images (merge, panels A - E) were captured with Slidebook 5.0 software (Intelligent Imaging Innovations, Inc., Denver, CO). Images were not deconvolved or processed further. Each image is representative of at least 20 fields photographed and compared for each experimental condition.

