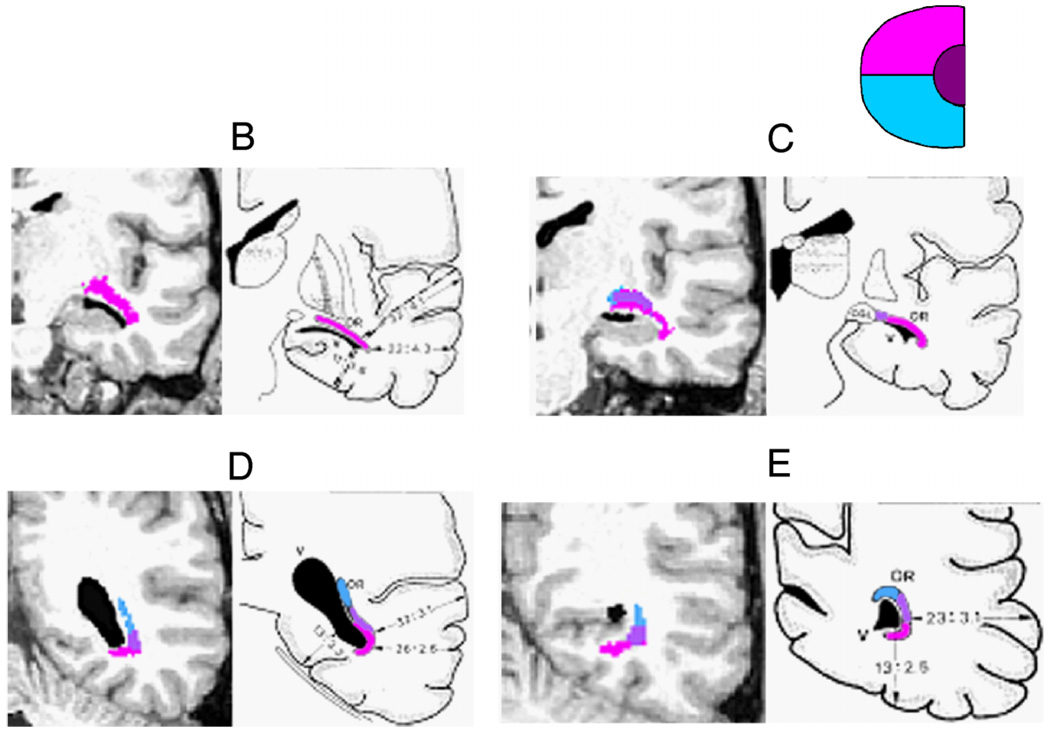
Figure 5.
Coronal sections showing the position of the direct, central, and Meyer’s loop bundles within the OR. Each panel compares an MR image and estimated fibers (left) with illustrations from a dissection study (Ebeling & Reulen, 1988) (right). The positions of the OR bundles are shown by the color overlays, and the expected visual information carried by these bundles is indicated by the inset (upper right). The locations of the coronal slices (B, C, D, and E) are shown in Figure 3. Subject S1.

