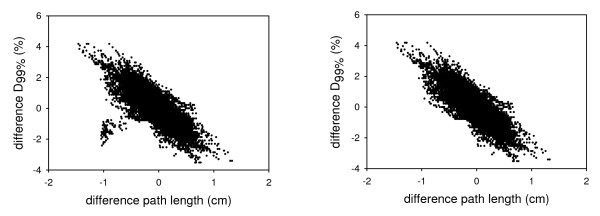
Figure 5.
Correlation difference D99% and path length change. a: The results of all simulations of all 25 patients with respect to the treatment plan. On the X-axis is the difference in path length weighted with MUs (PPLMU) with respect to the treatment planning and on the Y-axis is the difference in dose with respect to the treatment plan. b: The results when patient P is excluded.

