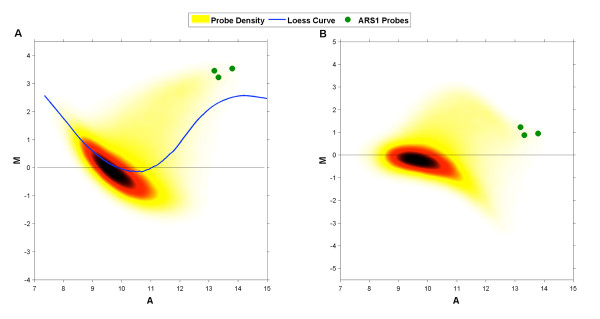
Figure 1.
Testing Loess Normalization. Illustration of loess normalization for BrdU-IP-chip data. (A) The density of all WT probes on the MA plane (red) before normalization (probes within ARS1 are denoted with green dots). During loess normalization a loess curve is fitted to the probes in this plane. (B) Probes on the MA plane after the loess curve has been subtracted from their M-values. Note that M-values of ARS1 probes have been pulled towards 0.

