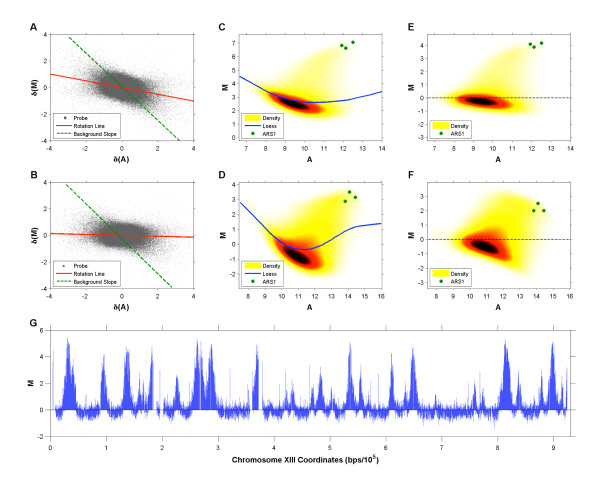
Figure 2.
Testing ChIP-chip Normalization Methods. Illustration of method proposed in [18] for normalization of BrdU-IP-chip data. Each probe in the WT (A) and rpd3Δ (B) datasets is plotted in the δ(M) vs. δ(A) plane and a line of best fit, which should run parallel to the slope of the background distribution, is identified. The WT (C) and rpd3Δ (D) probes transformed onto the modified MA plane with probes from within ARS1 highlighted (green). Following this transformation a loess curve is fitted to probes within 2 standard deviations of the median M-value. WT (E) and rpd3Δ (F) probes after the final loess normalization step. (G) Raw M-values of WT probes plotted in the chromosomal plane (chromosome XIII shown here).

