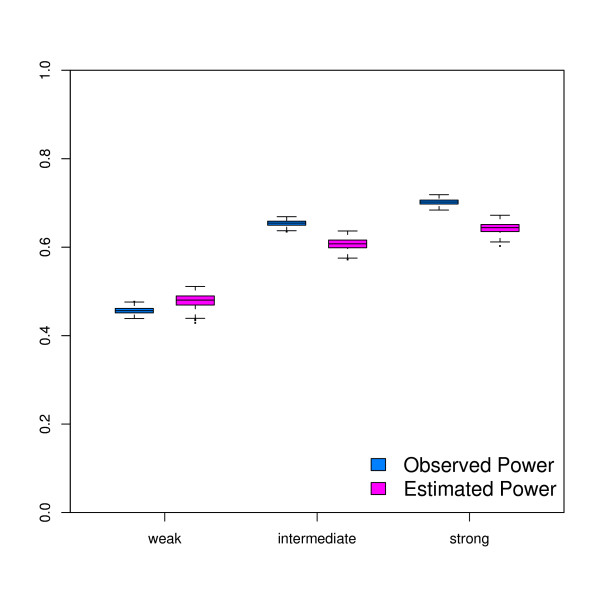
Figure 1.
Simulation Experiment: Compares estimated powerwith the true positive rate. Box-and-whisker plot of the estimated average power and true positive rate for all the simulations, for the three different effect size distributions. The Power is displayed on the y-axis and the different simulation scenario's are displayed on the x-axis fromleft to right: weak-, intermediate- and strong-effect sizes respectively.

