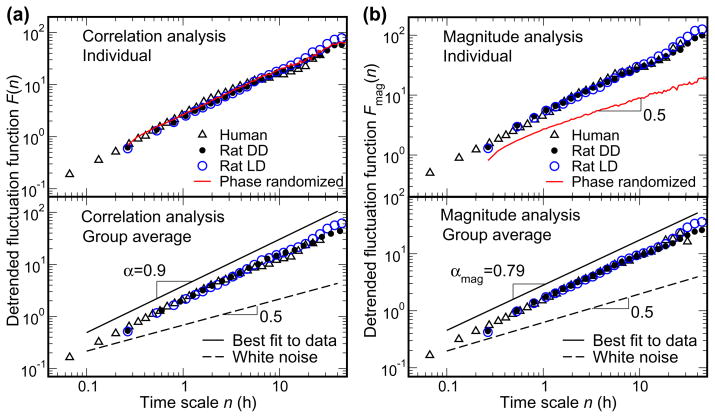
Fig. 1.
Similarity of scale-invariant patterns of activity fluctuations in humans and rats.
(A) Correlation analysis and (B) magnitude analysis (nonlinear properties) in the activity recordings throughout 10 day protocols in the laboratory in a representative individual human, a representative individual rat (upper plots), and in the group averages (lower plots). The phase randomized surrogate data (red line) was generated from the rat data during DD by performing a Fourier transform, preserving the amplitudes of the Fourier transform but randomizing the phases, and then performing an inverse Fourier transform. Such surrogate data has the same correlation properties as the original data, but contains no nonlinear information embedded in the Fourier phases. Data are shown on log-log plots. On the abscissa, n represents the time scale in hours. The detrended fluctuation functions F(n) and Fmag(n) are depicted on the ordinates in A and B respectively. Note, for both humans and rats, before averaging, the data of each subject were normalized to account for individual differences in the standard deviation of activity. The lines depicting the best fit to the data are vertically shifted for better visualisation, but the slope remains the same. The dashed line indicates the exponent 0.5 which occurs with a random signal (white noise). The power-law form of F(n) and Fmag(n) with α and αmag >0.5 indicate long-range correlations and nonlinearities in activity data. Virtually identical scaling exponents in humans and rats (α=0.90±0.04 [SD] and αmag=0.79±0.04 for human, α=0.89±0.04, and αmag=0.79±0.02 for rats during LD, and α=0.85±0.06 and αmag=0.75±0.04 during DD) indicate the same scale-invariant patterns in the two species. Scaling exponents are obtained by fitting data in the range from ~16 minute to 24 hour.

