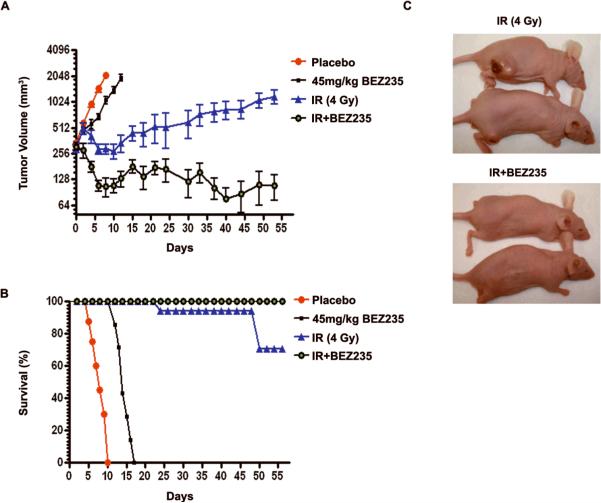
Figure 5. Effect of BEZ235 and IR in a xenograft tumor model.
A. Xenograft growth of H460 cells in nude mice treated as indicated. The graph shows xenograft volumes. Each point represents the mean of tumor volume (mm3) of each treatment group (n = 7); bars, SEM; ***P<0.001 between mice treated with IR to mice treated with IR+BEZ235. Mice were sacrificed when tumor volume reached 2000 mm3. B. Kaplan-Meyer curve of H460 xenografts treated as indicated. ***P<0.001 between all survival curves C. Representative pictures of mice 50 days after initiation of treatment.

